Recently we published a paper called “A Comparison of Preservation Management Strategies for Paper Collections“, in which we used a mathematical model to predict how paper collections will respond to de-acidification and improved storage conditions. We also considered the implications of delaying a decision. This work is the brainchild of Cristina Duran, a paper conservator who develops brilliant mathematical models — or, perhaps, increasingly a modeller who conserves paper. To explain in broad brushstrokes how the model we used works, I will draw parallels with a type which is painfully topical: the epidemiological model.
The maths we use to predict how a collection of paper records will change over time are very similar to those used to predict the spread of viruses. After the first wave of Covid-19 in 2020, there was a wave of modelling results: we learned about exponential growth, the R0 parameter and the costs of uncertainty. I always find my research on modelling very difficult to communicate; but the pandemic shows that, given enough motivation, any scientific concept can become part of our daily vocabulary.
The models of viruses and of paper collections are similar in three key steps, which I will go through one by one.

The first step is the creation of a Good but Simple Model: a simplification of reality that works well enough. It lets you say useful things without making the maths impossible to solve. This is done by reducing a complex process to the minimum number of parameters required to explain it. In the case of virus transmission, we are all familiar with these parameters: the number of social interactions affects the rate of propagation. Age and pre-existing conditions affect the chances of survival. We need little else to begin modelling. In the case of paper collections, we can make a Good but Simple Model thanks to years of experimental research. This model tells us that the durability depends mostly on acidity, current condition, frequency of handling and storage conditions. Of course, there will be other parameters. But, you see, a good model does not need to be perfect. The best model is like a Hobbit: small and humble, enjoys the good life, but is incredibly dependable.
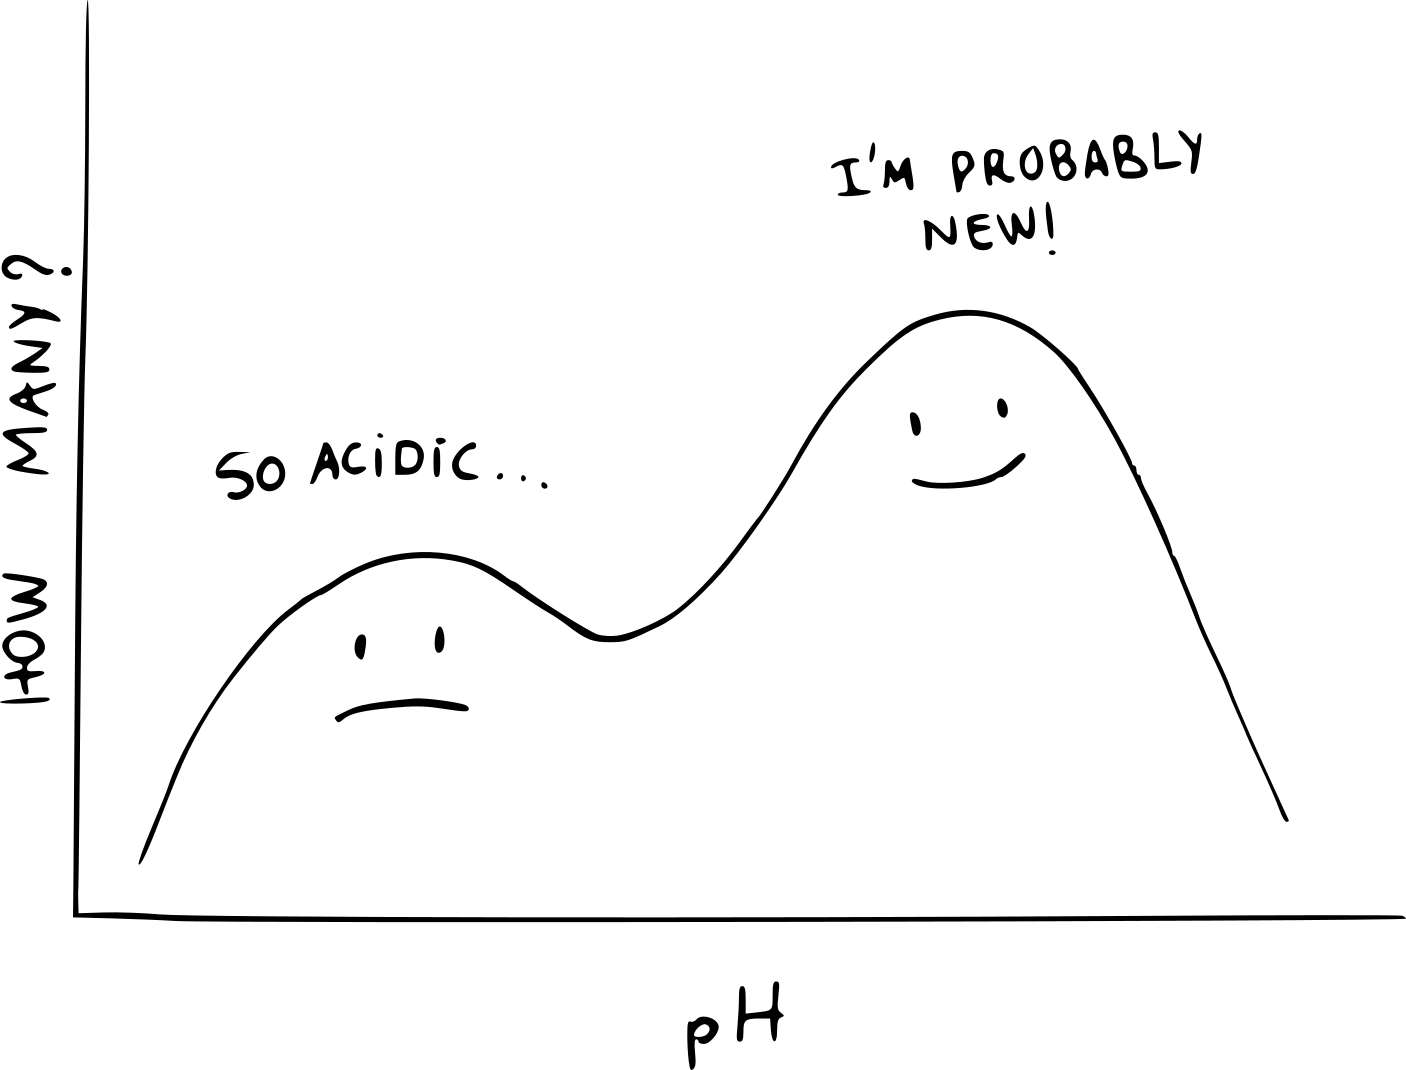
The second step is to measure these parameters in the population. In the case of viruses, modelers need to know the number of young and old people. They also need to estimate how frequently they will interact with others. In the case of paper collections, we need to know at least three things about our collection: the pH, the current level of degradation, and how frequently each item is handled. Of course, in neither viruses nor paper do we need to know this for every case. It is enough to know how these properties are “distributed”. Is everyone the same age? Or are there many in a certain age group, and few in others? And so on.
The third step is to see how these groups will change with time, given the rules established in the first step. Although this can be done in many ways, a very intuitive method which we use is “agent-based modelling”. Quite simply, you generate a very large number of digital individuals (or collection records) and you simulate how they will behave. Often, each simulation ends up with a different result. For example, an unpopular book might be requested in one simulation and not in another one. In order to observe typical behaviour, we run these simulations hundreds of times. Usually, there will be outcomes that are much more common than others.
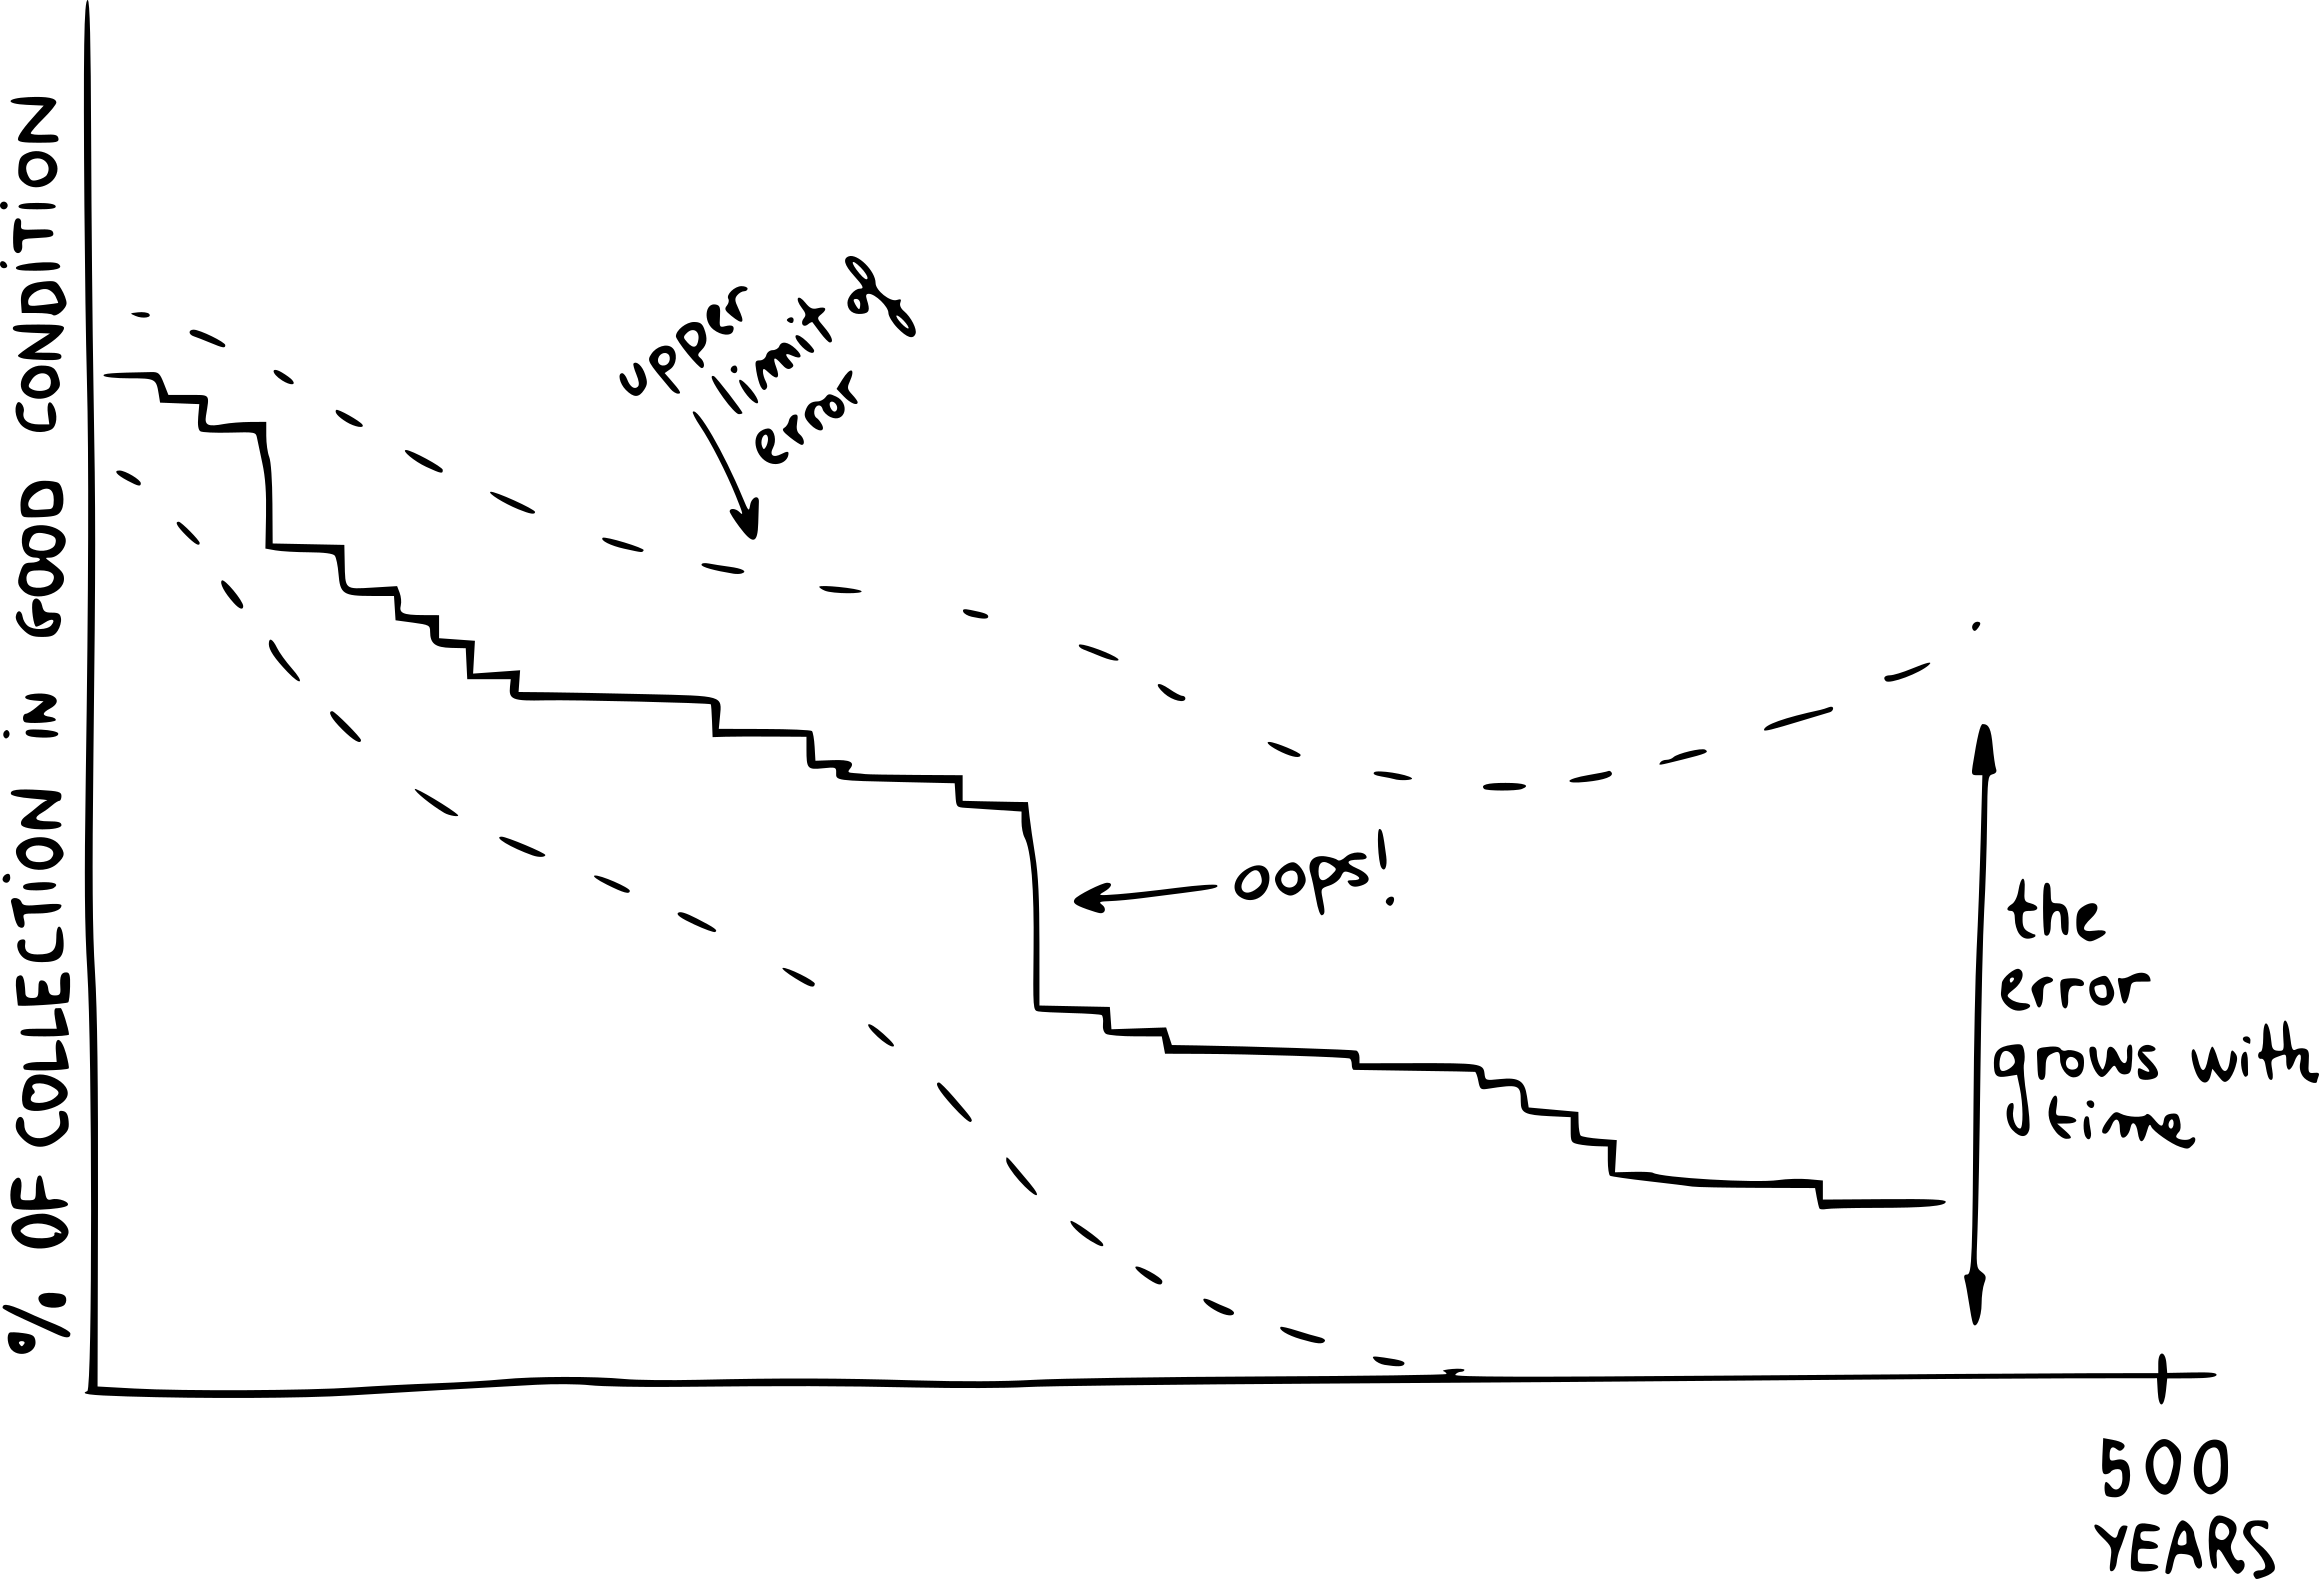
As you can imagine, these three steps produce very uncertain results. The further into the future you want to predict, the more uncertainty you will have. In the case of pandemic modelling, uncertainty has big political implications. Someone must make a quick judgement using imperfect evidence. In the case of paper collections, we are blessed with time. Generally, we can wait and see whether our forecasts are correct. For example, in our publication we explain that a small change in the environment (from 18°C to 16°C and from 50% RH to 40% RH) will mean that, in 500 years, an additional 30% of the collection will continue to be in a usable state. However, it will take a long time before we can check whether this result is realistic. Today, the model simply tells us that one small improvement can have a big impact. Of course, we take every trouble to communicate that a simulation is not a prediction, but rather the expression of a trend over time. When we can, we add big error bars that illustrate this. So if you ask me how good our model is, I can answer without a worry: I will tell you in 500 years.
All images courtesy of Dr Josep Grau-Bove (2021).
Dr. Josep Grau-Bove is a Lecturer in Science and Engineering in Arts, Heritage and Archaeology. He is a Chemical Engineer who did his PhD on the simulation of dust in indoor heritage sites (University College London, 2015). His research focuses on the development of new technologies for preventive conservation, usually involving computer simulations, data analysis and citizen science. He is the director of the MSc in Data Science for Cultural Heritage.
